|
|
You are here: Foswiki>ABI Web>LectureWiki>AdvancedAlgorithms>QuantProtP4>QuantProtP4_Elution (19 Jul 2010, StefanMendt)Edit Attach
Page QuantProtP4_Elution
Project Planning for QuantProtP4 - Elution Profile comparisonStatus - Stefan
- implement a C++ code (Main.C, see attachment) to determine the elution profile for each feature; output: intensity values + a feature number
- implement a C++ code to get the consensus features
- refine Main.C (version2), output: four files 1) intensity values 2) retention time values 3) unique feature ID 4) consensus features
- convert output files for better handling in R (.Rdata)
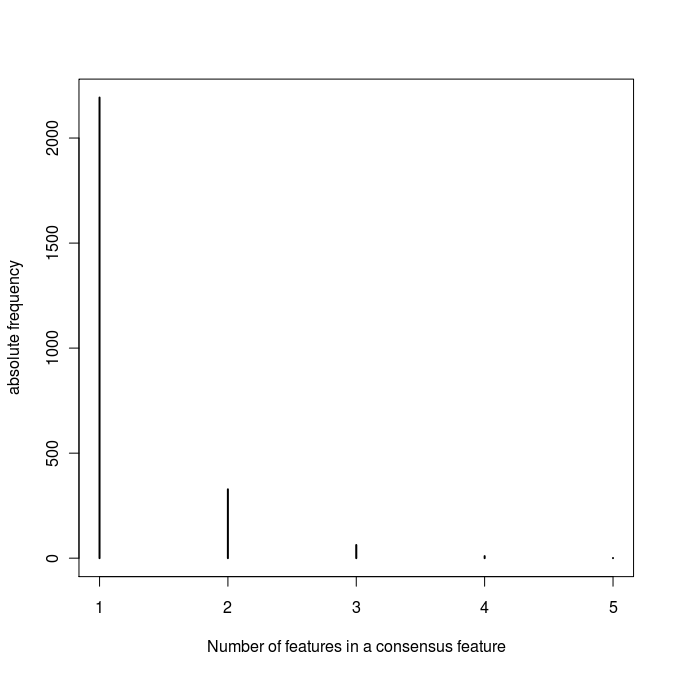
- 3083 features in 2595 consensus groups (plot 1 & 2)
- 402 consensus groups consist of at least 2 features, which results in 890 features total
- we want analyse the 890 features within 402 consensus groups
- to compare the features we use the pearson correlation coefficient
- compare scores of of features within one group with scores of features from distinct groups
- Functions
- to compare two features have to be equal length/width
- centerRT (consider index) - the shorter of two features get added with null values at both sides (plot3)
- equalLength (consider retention time) - some time series are not consecutive, missing time point was added / both features get the same retention time (plot4)
- calculate score matrix one for each function to get features with equal length
- to compare two features have to be equal length/width
Status - Peter
- todo include a fitting function in from OpenMS in Main.C - did not manage
- smoothing elution profiles with R
- save new data points (same nr of points for every feature → features get the same width)
- Pearson correlation
Output
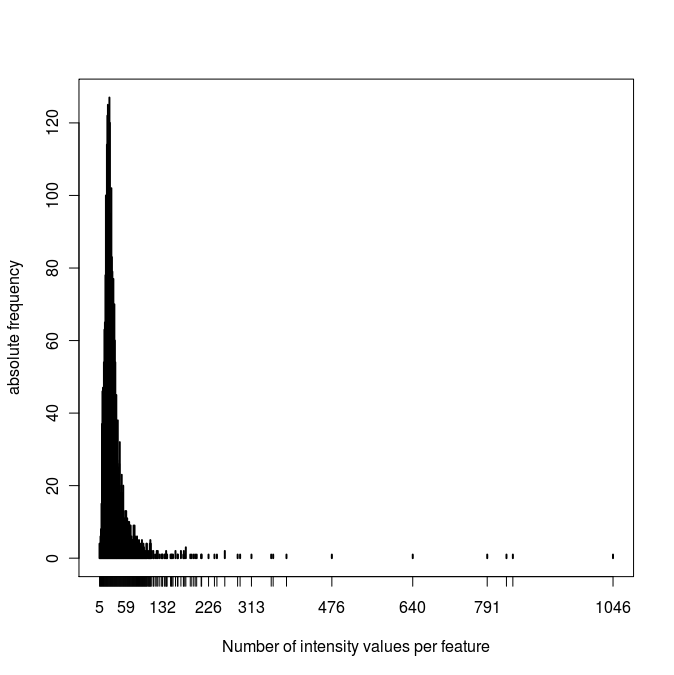
- plot_1: Number of intensity values for each feature (see attachment)
- plot_2: Number of features which belong to a consensus feature (see attachment)
- plot_3: left side: collected data points for features from OpenMS; right side: the feature with smaller length get centered to the greater feature, here only the time steps (index) are considered
- plot_4: left side: collected data points for features from OpenMS; right side: additional data points for the feature to get them in equal length, here the retention time are considered
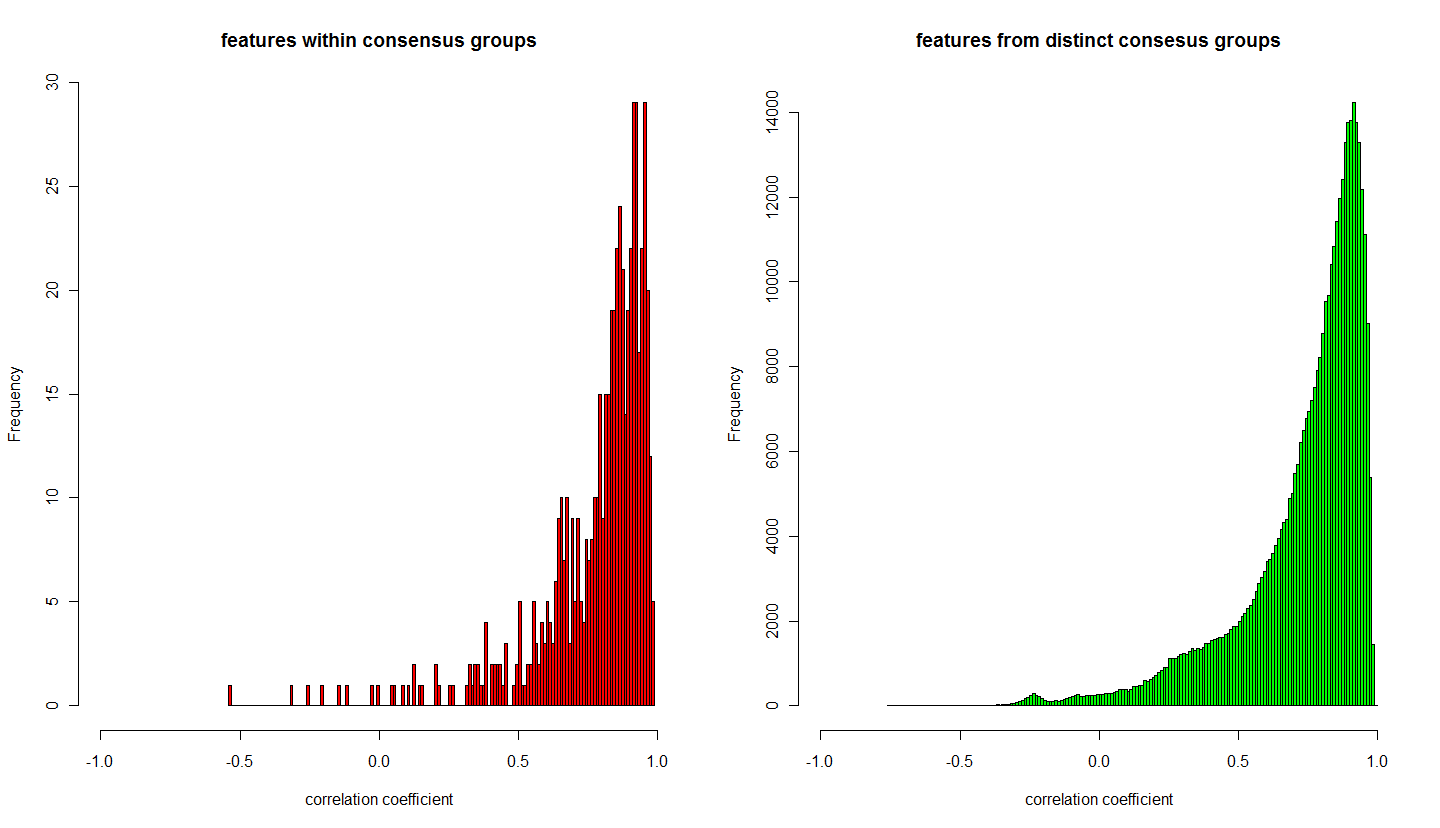
- plot_5: (centeredEP)frequency of correlation coefficients of features which belong to a consesus group (red) and of features between consensus groups
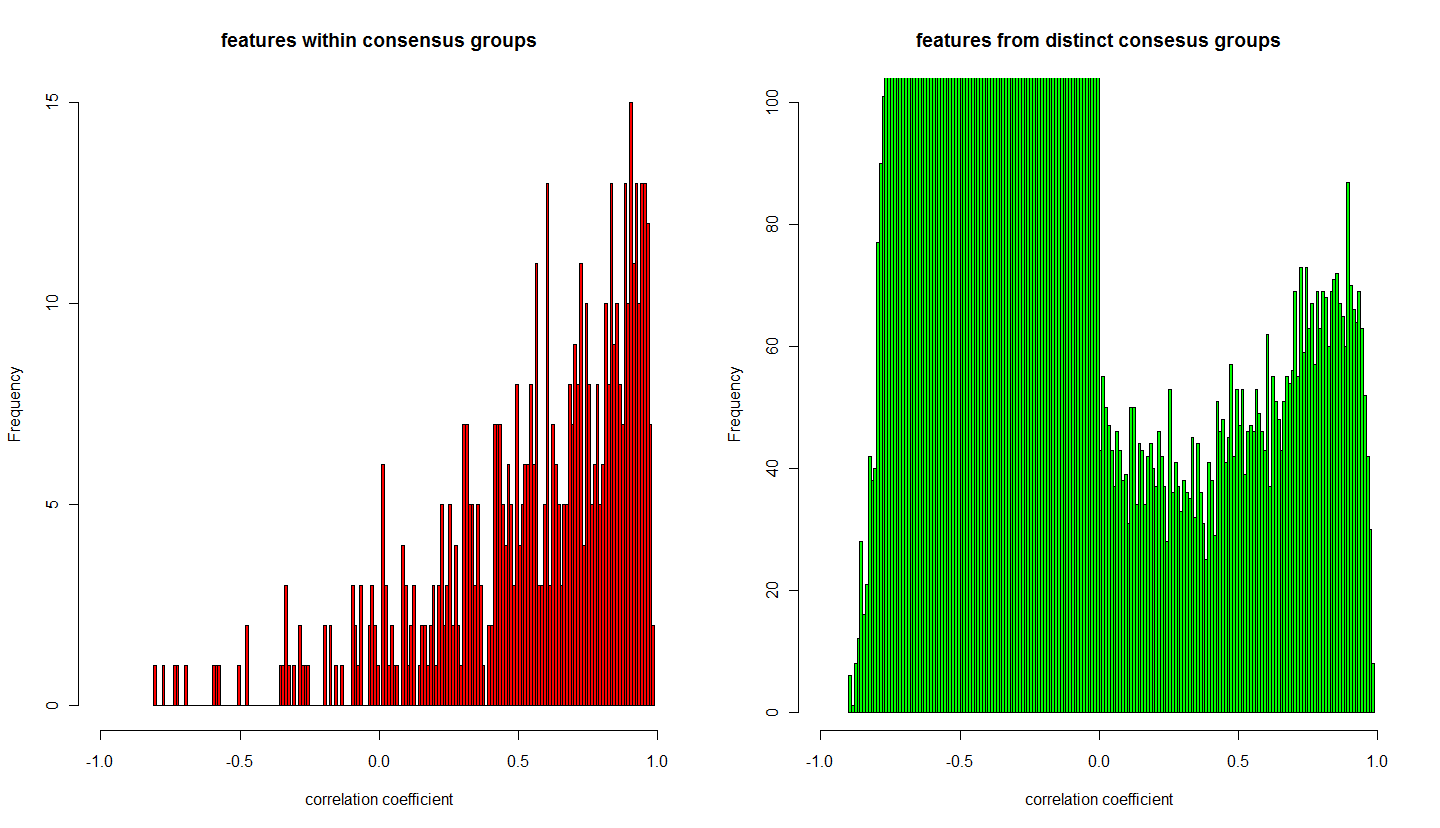
- plot_6: (equalLength) frequency of correlation coefficients of features which belong to a consesus group (red) and of features between consensus groups (green)
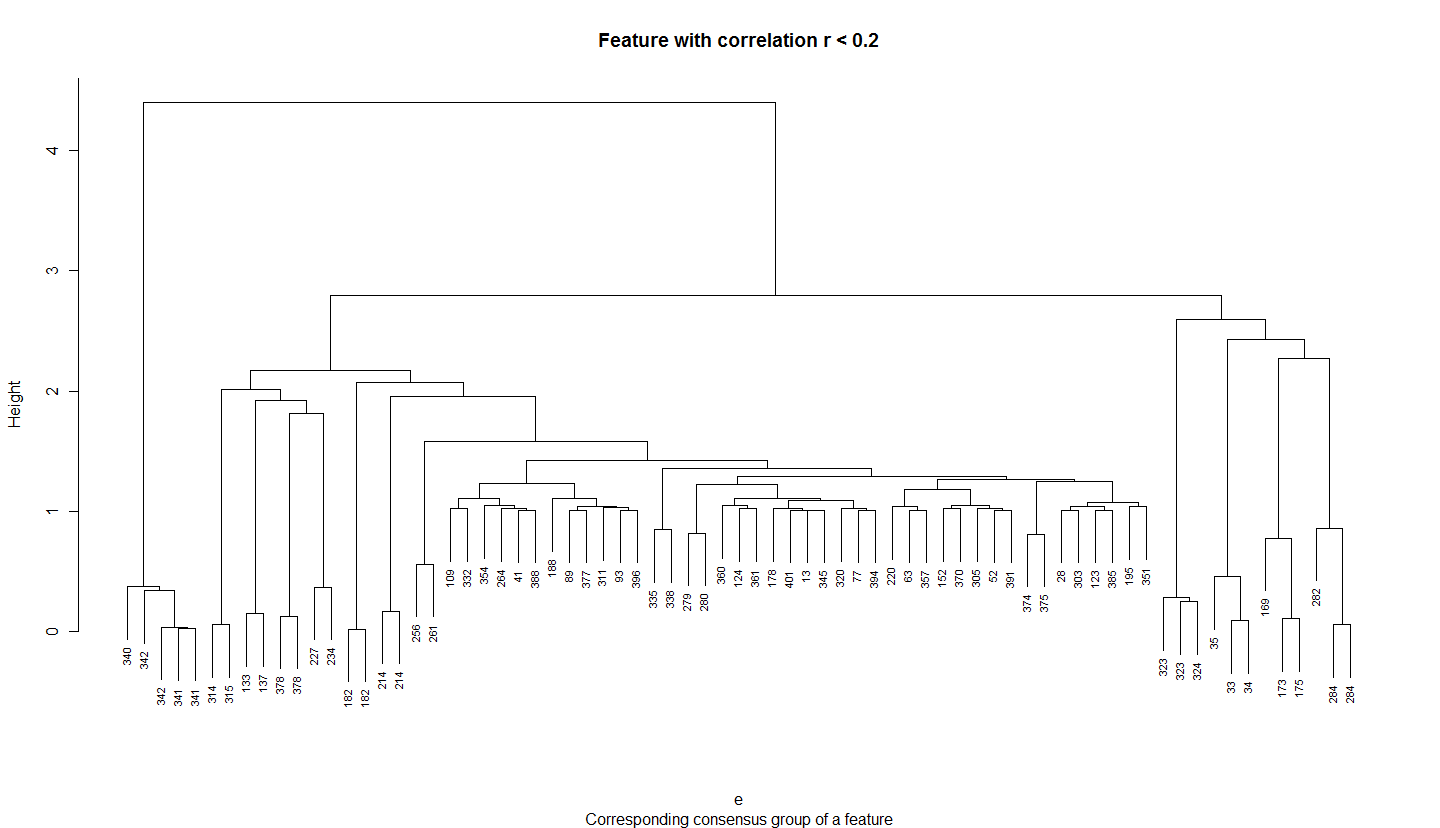
- plot_7: for equalLength data, clustering (ward method) of features within a group and a correlation smaller the 0.2
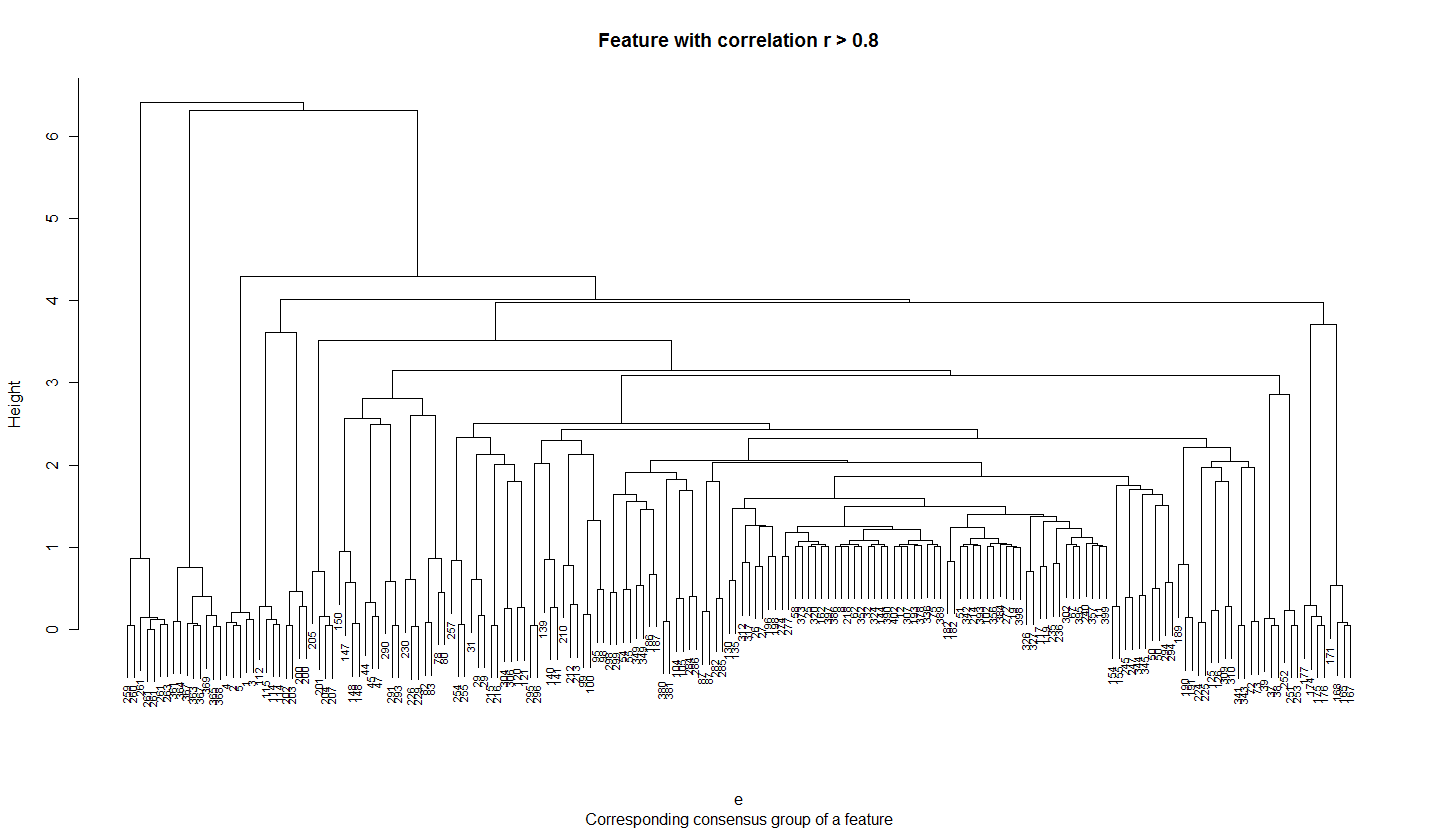
- plot_8: for equalLength data, clustering (ward method) of features within a group and a correlation greater than 0.8
- plot_9: (after smoothing function) frequency of correlation coefficients of features which belong to a consesus group (red) and of features between consensus groups (green)
Timeline/Progress
- get raw data here: http://page.mi.fu-berlin.de/bielow/P4/elution_profile.zip
- extract chromatograms and a list of features which belong together
- useful OpenMS classes
- AreaIterator, Feature, FeatureMap, FeatureXMLFile, ConsensusMap, ConsensusXMLFile, MSExperiment, MzMLFile
- the raw data file (.mzML) contains the actual peaks, the feature file (.featureXML) describes which datapoints in the mzML file belong to one feature (see Feature→ConvexHull→BoundingBox). Corresponding features are grouped in the consensus feature file (.consensusXML).
- useful OpenMS classes
- choose metric
- Pearson correlation?
- Mann Whitney U test?
- …
- using the metrices
- for any two features A and B they are either * linked (i.e. belong into the same group in the consensusXML) OR * unrelated
- compute the metric for all pairs A/B based on their elution profile
- evaluate (todo)
- distribution of scores of a) elution profiles belonging together v.s. b) unrelated features' elution profiles given different metrics
- can you find two clusters of scores? i.e. one for linked feature pairs and one for unrelated feature pairs, Does one scoring function give more clear clusters compared to other scoring functions?
Material
Papers using RT correlationhttp://www.springerlink.com/index/10.1007/978-3-540-71233-6
http://www.ncbi.nlm.nih.gov/pubmed/19664259 OpenMS docu:
http://www-bs2.informatik.uni-tuebingen.de/services/OpenMS/search/OpenMS/doc/html2/classes.html Programming with OpenMS (ie use OpenMS classes in your own C++ project):
http://www-bs2.informatik.uni-tuebingen.de/services/OpenMS/search/OpenMS/doc/html2/external_code.html You can probably avoid using 'my_custom_lib', as one main program should suffice.
Comments


| I | Attachment | Action | Size | Date | Who | Comment |
|---|---|---|---|---|---|---|
| |
Cluster_atL2equal_RedGreaterThan0.8_2.png | manage | 20 K | 18 Jul 2010 - 23:15 | UnknownUser | plot_8 |
| |
Cluster_atL2equal_RedLowerThan0.2_2.png | manage | 13 K | 18 Jul 2010 - 23:15 | UnknownUser | plot_7 |
| |
ElutionProfile_cen.pdf | manage | 19 K | 18 Jul 2010 - 23:11 | UnknownUser | plot_3 |
| |
ElutionProfile_equ.pdf | manage | 20 K | 18 Jul 2010 - 23:12 | UnknownUser | plot_4 |
| |
Histo_atL2center_Pearson.png | manage | 11 K | 18 Jul 2010 - 23:13 | UnknownUser | plot_5 |
| |
Histo_atL2equal_Pearson.png | manage | 14 K | 18 Jul 2010 - 23:13 | UnknownUser | plot_6 |
| |
Main.C | manage | 3 K | 08 Jul 2010 - 11:52 | UnknownUser | version2, output: RT, I, uniqueID, Consensus features |
| |
NumOfFeperCoFe.png | manage | 14 K | 08 Jul 2010 - 18:36 | UnknownUser | plot_2 |
| |
NumberOfIperEP.png | manage | 20 K | 08 Jul 2010 - 18:36 | UnknownUser | plot_1 |
| |
SmoothingData_PearsonCorr.pdf | manage | 176 K | 19 Jul 2010 - 00:01 | UnknownUser | plot_9 |
Edit | Attach | Print version | History: r16 < r15 < r14 < r13 | Backlinks | View wiki text | Edit wiki text | More topic actions
Topic revision: r15 - 19 Jul 2010, StefanMendt
Ideas, requests, problems regarding Foswiki? Send feedback