Domain coloring wins international visualization contest of Science magazine and NSF
Unsere Visualisierung einer komplexen Funktion erhält "Honorable Mention"-Auszeichnung in der Illustration-Kategorie der jährlichen International Science & Engineering Visualization Challenge und erscheint am 03.02. im Wissenschaftsmagazin "Science".
News from Feb 03, 2012
Science Magazine
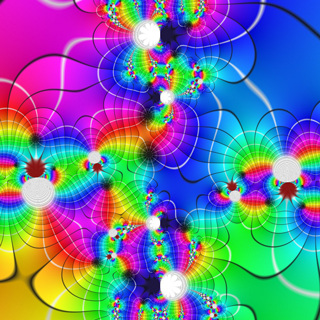
Mathematicians discover their hippie sides. Forgoing long strings of digits and variables, researchers at the Free University of Berlin have taken a tie-dye approach to visualizing math equations. This illustration represents one example of a complex function. Such functions are mathematical relationships that incorporate both real numbers and what experts call imaginary numbers, such as the square root of −1.
Unlike familiar sine waves or logarithmic curves, complex functions are four-dimensional, combining both inputs and outputs in two dimensions. To visualize these heady equations, Konstantin Poelke and his Ph.D. supervisor Konrad Polthier turned to and improved a technique called domain coloring. They assigned each complex number in their equation to a spot on a color wheel. The further numbers get from zero, the brighter they are (white regions, for instance, represent mathematical “singularities” that approach infinity). The result is like a topographic map, but it packs two dimensions of information (hue and brightness) into each point instead of the single dimension of altitude.
Such functions may fly right over the heads of many nonmath enthusiasts, Poelke says. But he hopes casual viewers will understand the basics of the relationships between the complex numbers shown here just by looking at the arrangement of the psychedelic shades.
National Science Foundation
"Exploring Complex Functions Using Domain Coloring," by Konstantin Poelke and Konrad Polthier, Free University of Berlin, received honorable mention th the Illustration category of the 2011 International Science & Engineering Visualization Challenge, sponsored by NSF and AAAS.
Süddeutsche.de
Mit Hilfe von Farben versuchen Forscher komplexe mathematische Funktionen zu visualisieren. Einem bestimmten Schema folgend ordnet man eine Farbe einer komplexen Zahl. Auf einem entsprechenden Bild lassen sich dann kritische Werte wie etwa null (schwarze Stellen) oder Singularitäten (weiße Stellen) auffinden.
Welt Online
Gleichungen wie im Drogenrausch: Mathematiker der Freien Universität Berlin zeigen komplexe logarithmische Kurven in ihrer schönsten Form. Konstantin Poelke und Konrad Polthier wiesen jeder Zahl eine Farbe zu. Je weiter diese von der Null entfernt ist, desto heller erscheint sie im Bild.
cnet
This image is a visualization of a complex math problem. Each complex number in an equation is a color, and the farther they are from zero (the white area), the brighter the picture. The idea is to show the differences between complex numbers.
SCIENCE.ORF.at
Mathematiker haben es üblicherweise besonders schwer, ihre Forschungsergebnisse zu verbreiten und noch mehr sie zu illustrieren. Konstantin Pölke und Konrad Polthier von der Freien Universität Berlin ist dies hingegen überaus gelungen. Sie illustrierten eine komplexe mathematische Funktion mit vier Dimensionen, indem sie verschiedenen Zahlenbereichen verschiedene Farben zuordneten. Herausgekommen ist ein beinahe psychedelisch zu nennendes Bild, aus dem man aber doch Eigenschaften der Funktion herauslesen kann, wie die Forscher versichern (weiße Bereiche etwa stehen für mathematische Singularitäten).
POPSCI
Complex functions are important in many areas of mathematics, physics and engineering. A complex function is one in which both variables are complex numbers. The picture shows the visualization of a complex function using a specifically designed color scheme.
Following a technique called 'domain coloring,' the color scheme assigns a certain color to every complex number, inducing a coloring of the function domain according to its values at every point. So using this picture, you can explore properties of the function by easily spotting zeroes (black spots) or singularities (white spots). Contour lines indicate how the function deforms the complex plan.
msnbc
Delightful domains
Complex functions are of fundamental importance in many areas of mathematics, physics and engineering. This illustration shows the visualization of a complex function using a specially designed color scheme. Following a technique called "domain coloring," the color scheme assigns a certain color to every complex number, inducing a coloring of the function domain according to its values at every point. Honorable mention, image courtesy of Konrad Polthier and Konstantin Poelke, Free University of Berlin.
futuregiraffes
This honorable mention visualization shows the visualization of a complex function using colors to represent every complex number. Complex functions are important in math, physics and engineering.
seattlepi
Deadhead tie-dye? No, it’s “domain coloring,” a kaleidoscopic visualization of math equations, in which each complex number is assigned a color.
Le soir
Cette image bariolée est la représentation de différentes variantes de fonctions mathématiques complexes. Ce type d'images permet d'explorer les propriétés des fonctions en question. Du chinois ? sachez que le points noirs représente des zéros et les points blancs des « singularités ». Quand aux lignes de contours, elles indiquent comment les fonctions déforment le plan.
TECNOLOGIAERICERCA.COM
Le funzioni complesse sono fondamentali in diverse branche del sapere: dalla matematica, alla fisica e all’ingegneria. Questa immagine mostra la visualizzazione di tali funzioni attraverso uno specifico schema di colori che assegna a ogni numero complesso una tonalità diversa. Così è possibile studiare facilmente le proprietà della funzione: per esempio, risaltano immediatamente i valori critici come gli zero (punti neri) o le curve, che indicano, invece, come la funzione deforma il piano complesso.

