GUI supported parameter optimization
Abstract
In dieser Arbeit sollen eine GUI (graphical user interface) und Methoden zur Parameter-Optimierung implementiert werden, um Wissenschaftlern den Einsatz von OpenMS im Wet-Lab erleichtern.
Contents
One of the first steps in the analysis of mass spectrometry data is to search for peaks in the raw spectrum data acquired by the instrument. This process is called peak picking. A common difficulty with peak picking algorithms is that they may depend on reasonable settings for certain parameters which are sometimes hard to find without user interference.
The goal of this master's thesis project is to:
- Identify critical parameters for the peak picking algorithm(s) implemented in OpenMS (http://www.OpenMS.de)
- Define quality criteria for the result of peak picking.
- Develop an automatic or semi-automatic procedure to optimize the algorithmic parameters (*)
- [Optionally, implement algorithmic improvements suggested by experience from the steps above.]
(*): This will probably involve design and implementation of a GUI, which aids in the manual annotation of reference signals. The TOPPView application implemented in OpenMS can be extended to support this. TOPPView is implemented using the Qt library (http://trolltech.com/products).
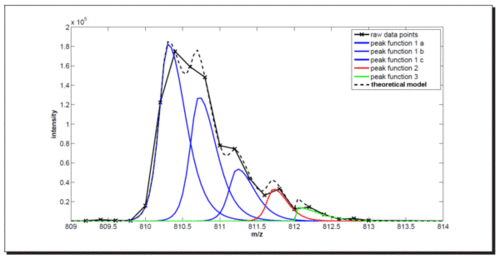
Our work on peak picking in OpenMS is based on a decomposition of the raw signal into components which live on different scales, i.e. slowly changing baseline, high-frequency noise, and in between we expect the proper signal caused by the interesting chemical compounds in the sample.One intended way to assess the quality of the decomposition is to check whether the resulting signal components match their specific, defining characteristics. The baseline can be analyzed by histogramming over a sliding window. The noise can be characterized by Fourier analysis. The proper signal can be assessed by comparing the actual data with the theoretical models which are used to assign parameters such as FWHM (full width at half maximum), intensity, or skewness. Algorithmic improvements could be to exploit existing correlations among parameters such as m/z (mass-to-charge ratio) and FWHM.
User input can be given in the form of manually chosen reference signals. The optimized parameters can then be used to extend the reference set and the process can be iterated in an expectation-maximization framework.
Time table
The allocated time is 6 month total.
| 0 - 1 | literature search and reading, write outline of thesis |
| 2 - 4 | implementation, testing |
| 5 | evaluation, documentation |
| 6 | finish writeup |


